Custom Charts
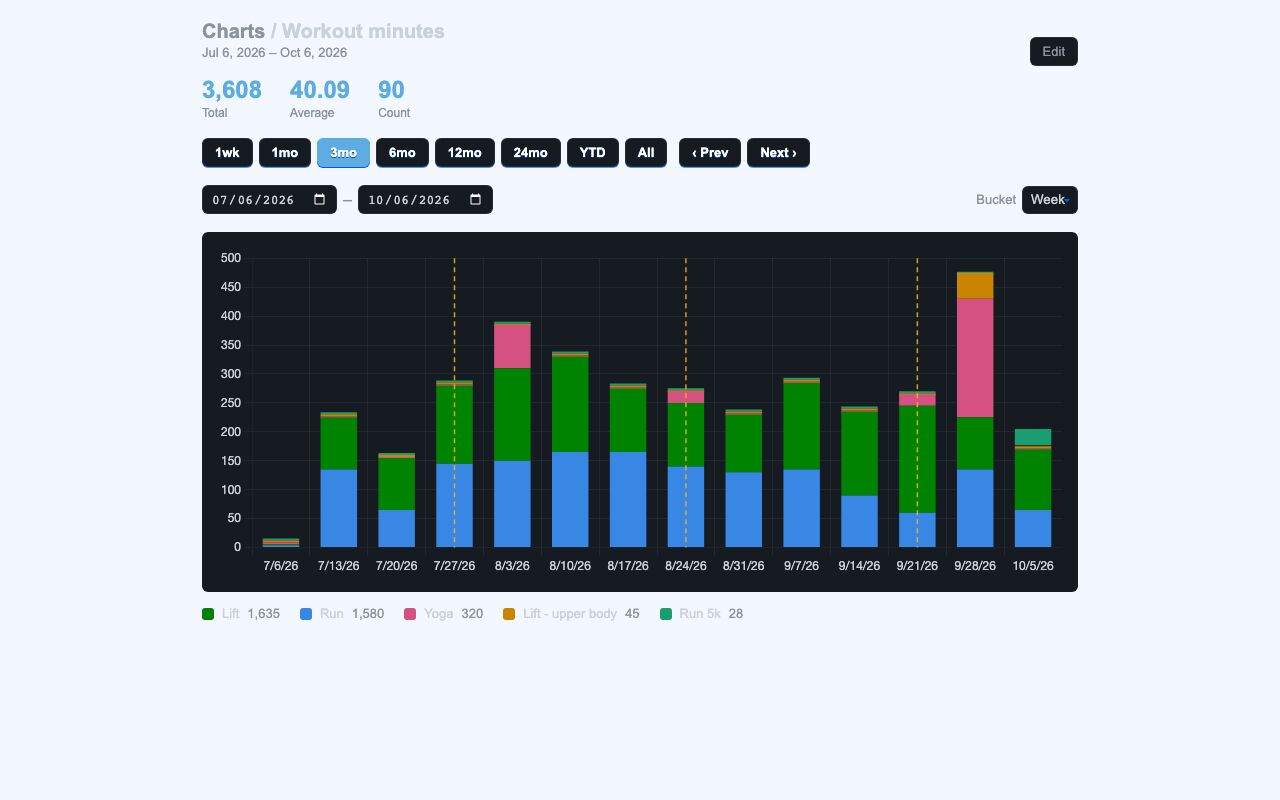
Custom Charts is a no-code chart builder for events already logged in the app. It lets a user define a query, choose how to measure and group the results, and view charts with summary numbers and date controls.
Custom Charts addresses the need to turn logged events into charts without writing code. It works over the app’s event log, so it can chart different kinds of events using the same search language.
What it solves
Custom Charts addresses the need to turn logged events into charts without writing code. It works over the app’s event log, so it can chart different kinds of events using the same search language.
It also gives control over how results are measured, grouped, bucketed, and displayed. That makes it possible to compare series, add reference markers, and review data across different time ranges.
Features
- Query-based filtering Uses the app’s search syntax to select the events that belong in a chart.
- Live preview Redraws the editor preview as the chart definition changes.
- Multiple series Supports one or more series, each defined by its own label and query.
- Metric choices Can count events, sum values, average values, or calculate min, max, and gap between occurrences.
- Flexible value sources Can use event counts, numeric notes, or a numeric field from JSON data.
- Series splitting Can split series by event name, notes, JSON keys, a JSON value, or sign.
- Time bucketing Groups data by day, week, month, year, or leaves it unbucketed.
- Chart types Supports bar, line, and stacked bar charts.
- Reference markers Draws matching events as dashed vertical lines with hover text.
- Summary and paging controls Shows total, average, and count tiles with range presets and previous or next window navigation.
How to use it
- Create a chart and give it a query that matches the events to include.
- Choose the value source and metric that match the data you want to measure.
- Add one or more series, then adjust labels, split rules, and colors if needed.
- Pick a chart type, time bucket, and default range.
- Optionally add marker query rules to show reference lines on the chart.
- Save the chart and review it on the chart page.
- Use the range presets, custom date range, bucket switcher, and window controls to inspect different views.
How it works
- It stores chart settings in a single JSONB column and merges defaults when settings are read.
- A chart builder service turns the saved settings and any overrides into a Chart.js-ready payload.
- Event filtering reuses the app’s shared search-query parser and returns a problem when a query is invalid.
- The client uses Chart.js with a custom plugin for marker lines and a custom tooltip for those markers.
- The editor sends debounced preview requests for unsaved changes, and chart changes fetch updated data for the selected chart.